Simulating Returns for the Robo-Advisor
In the past, we’ve asked users to state their risk preference without giving them any context as to what that risk preference should indicate.
Let’s present a more explicit query here, in which the robo-advisor presents a series of simulated returns to the user before asking about a risk preference.
We’ll start by simulating returns under a number of different risk levels.
import numpy as np
import seaborn as sns
import pandas as pd
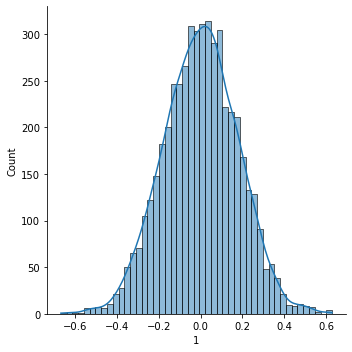
df = pd.DataFrame({'1': np.random.normal(0, .18, 5000),
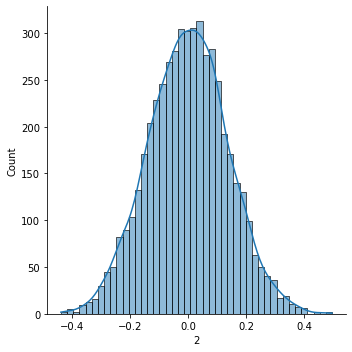
'2': np.random.normal(0, .14, 5000),
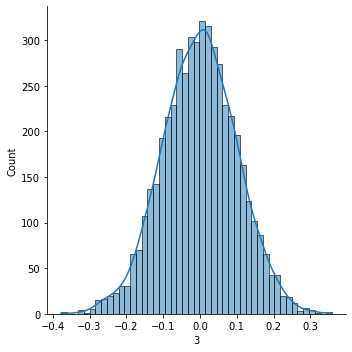
'3': np.random.normal(0, .1, 5000),
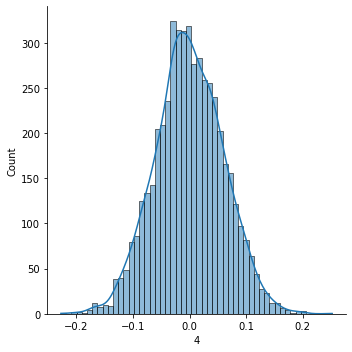
'4': np.random.normal(0, .06, 5000),
'5': np.random.normal(0, .02, 5000)})
df.head()
| 1 | 2 | 3 | 4 | 5 | |
|---|---|---|---|---|---|
| 0 | -0.318702 | -0.026151 | 0.114030 | -0.079973 | 0.018460 |
| 1 | -0.224672 | -0.116832 | 0.077373 | -0.053541 | -0.023312 |
| 2 | 0.240051 | -0.191198 | 0.060689 | 0.106966 | 0.000176 |
| 3 | -0.251498 | -0.056510 | 0.077290 | -0.032113 | -0.016402 |
| 4 | 0.171102 | -0.181625 | 0.090191 | 0.035760 | 0.007554 |
Next, have the function display these simulated returns. That way, a user has a visual representation of what a risky distribution of returns looks like under varying scenarios. People who are more concerned about risk tend to spend more time thinking about the left side of the distribution. In contrast, people who are more risk tolerant are more willing to accept a big left tail in exchange for a big right tail.
def get_risk_preference():

    # plot random returns
    sns.displot(data=df, x='1', kde=True)
    sns.displot(data=df, x='2', kde=True)
    sns.displot(data=df, x='3', kde=True)
    sns.displot(data=df, x='4', kde=True)
    sns.displot(data=df, x='5', kde=True)
    plt.show()

    need_preference = True
    while need_preference:
        response = input("On a scale of 1-5, how much do you dislike risk?  1=not bothered by risk, 5=extremely worried about risk.\n")
        try:
            response = int(response) # this will break if response is not 1-5
            need_preference = False
        except Exception as e:
            print('Please try entering your preference again')
    return response
get_risk_preference()
---------------------------------------------------------------------------
NameError                                 Traceback (most recent call last)
<ipython-input-3-7df71b16e131> in <module>
----> 1 get_risk_preference()

<ipython-input-2-7c1b17e2378c> in get_risk_preference()
      7     sns.displot(data=df, x='4', kde=True)
      8     sns.displot(data=df, x='5', kde=True)
----> 9     plt.show()
     10
     11     need_preference = True

NameError: name 'plt' is not defined