for Loops and Delayed Savings
Consider a slightly modified version of the lifetime savings problem provided above.
Once you begin contributing to a savings account, assume that you put away \(x\) dollars per year and expect an annual return of \(r\). How valuable is it to start saving now as opposed to \(10\) years from now?
Again, begin by defining some values for \(x\) and \(r\).
x = 5000
r = 0.06
Next, define two list variables. These will store the value of savings accounts over time. In the previous example, we updated the value for the savings account each year. Here, we record the value of the account at each point in time. This is useful because we can then plot the data and explore this delayed savings problem more carefully.
save_now = [x]    # value of saving account when savings starts immediately
save_later = [0]  # value of saving account when savings starts 10 years from now
These list variables store one value each (the value \(x\) and the value \(0\)), which corresponds to the value of the savings account at the beginning of year \(0\). Under the “save-now” plan, \(x\) is put away immediately. Under the “save-later” plan, \(x\) is not put away until year 10.
Now, what we want to do is think about what happens each year. In the first scenario (begin saving immediately), the savings account grows by (1+r) each year, plus an additional x that gets added in. In the second scenario, the savings account only begins growing after year 10, and contributions only begin in year 10. Before that, nothing happens.
Using if/else logic, a for loop, and the .append() function for lists, we can evaluate these two savings plans.
We’ll begin with the “save-now” savings plan, since this is similar to the problem from the beginning of the chapter. A difference implemented here is that we call the .append() function to add values to the save_now list.
for i in range(1,56): # loop over i from 1 to 55
    account_value_last_year = save_now[i-1] # e.g. for i = 1 (year 1), loop up account value at i = 0 (year 0)
    account_value_next_year = account_value_last_year * (1+r) + x
    save_now.append( account_value_next_year )
At the beginning of the chapter, we defined a variable savings, and updated that variable’s value each loop iteration. Here, the list variable save_now keeps track of each of the savings account values (that is, the value of the account at year 0, at year 1, …, at year 55). This is useful for plotting a figure, which we’ll do at the end of the chapter.
Next, we modify the above for loop to work on the “save-later” plan. The important distinction here is that, for the first ten years (list index values \(0-9\), since Python starts counting at \(0\)), no money is put in to the savings account. Thus, we set the first ten values of the save_later list equal to \(0\).
for i in range(1,56):
    if i > 9:
        save_later.append( save_later[i-1]*(1+r) + x )
    else:
        save_later.append( 0 )
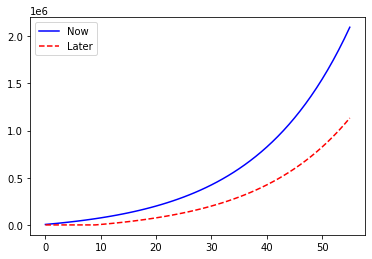
Plotting will be covered in greater detail in a later chapter, so don’t worry about understanding the meaning of the following code block. The important takeaway is what’s presented in the figure it creates.
%matplotlib inline

import matplotlib
import numpy as np
import matplotlib.pyplot as plt

plt.plot(range(0,56), save_now, color='b', label='Now')
plt.plot(range(0,56), save_later, color='r', label='Later', linestyle='--')
plt.legend()
plt.show()